
High-impact low-probability (HILP) events such as hurricanes, snowstorms, heat waves, and floods cause widespread power outages and blackouts. With the increasing challenges concerning the threats to the power systems and the growing need to mitigate the impacts of the HILP events, resilience has become a crucial desirable characteristic for the power grid infrastructures.
The operators within the control center of the power grid need to analyze previous threats and predict other possible threats so that pre-planning can be done to mitigate its impact on the overall power system.
RPIA: Resiliency planning and investment analysis is developed considering the impact of HILP events on the power grid. It comprises of development of planning and analysis for the resilient power grid with hydro generation and distributed energy resources (DERs). Hydro resources need to be coordinated with DERs to meet the grid resilience requirements while meeting water constraints. This tool facilitates the operator to identify the possible threats so that they can visualize and prepare strategies for assets safety, maintain inventory, alert customers beforehand, and reduce its impact on system resilience.
Finally, the qualitative assessment of the tool’s ability is explained by its contribution and effectiveness. It includes how investing in smart grid technologies such as remote-controlled switches, Distributed Energy Resources (DERs), and increased distribution automation can be beneficial for resilience enhancement.
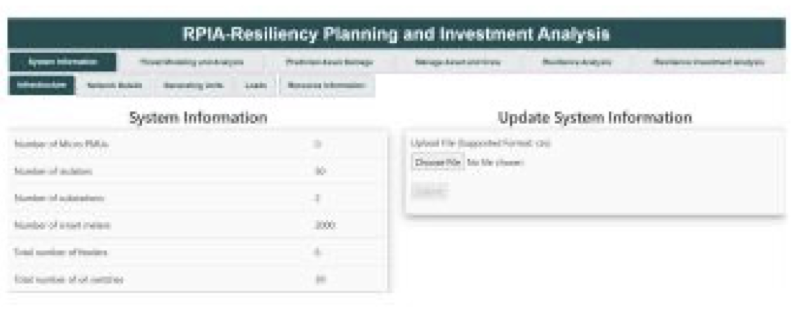
This helps the planner and operator to overlook and observe the system conditions from the control room.
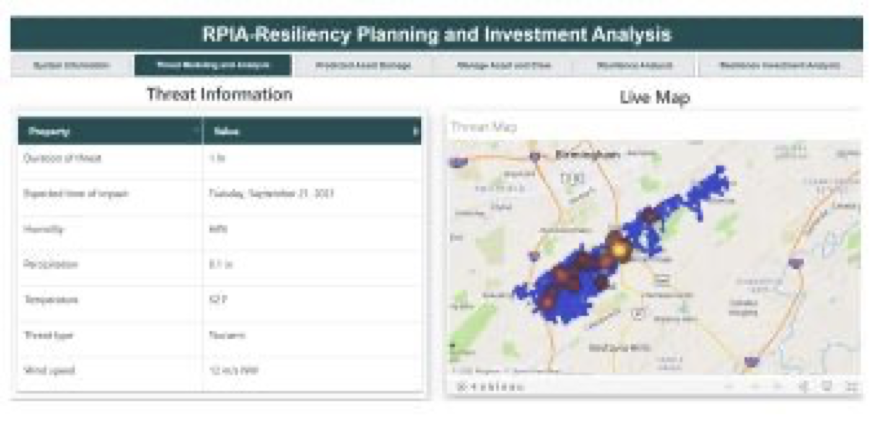
This tab provides upcoming threats and its visualization on system nodes that might be prone to threat (i.e., overlapping the map with heatwave taking different color intensities for threat affected zone).
This tab is built to disclose the expected asset damage based on the known trajectory of an abnormal event. It furnishes most probabilistic assets that can be affected by upcoming
This tab is shown in Fig. 6, which includes data tables that help in the estimation of crew and inventory requirements. The operator can predict inventory and crew requirements and compare them with their availability. This helps the operator to prepare for the event beforehand.

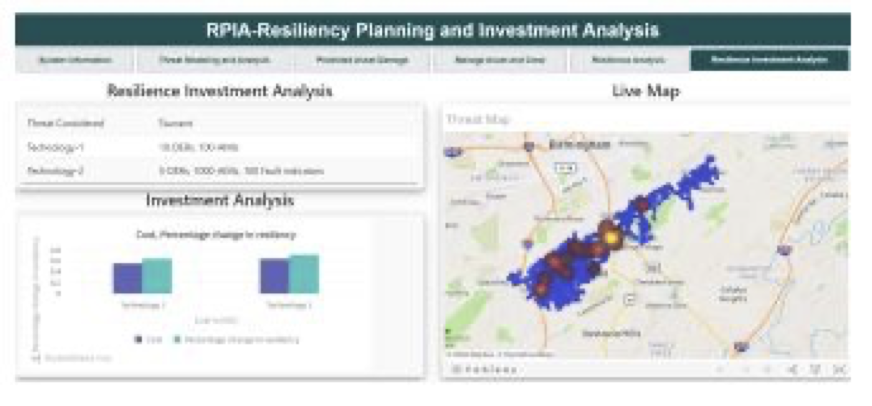
This tab reflects resilience analysis information for different use cases based on the specific condition and scenario of the system. It helps to visualize how adding the technology helps improve the resiliency score of the system.

In this tab, a data table displays the considered threat and details about different technology. We can see the live map displaying the nodes that predicted threats could impact on the right side.
For more details on the RPIA tool, please contact: anurag.srivastava@mail.wvu.edu